AgriVision:
Error-Driven Optimization
for Precision Agriculture
Dataset: Global Wheat Head Detection
Multi-institutional benchmark for agricultural object detection
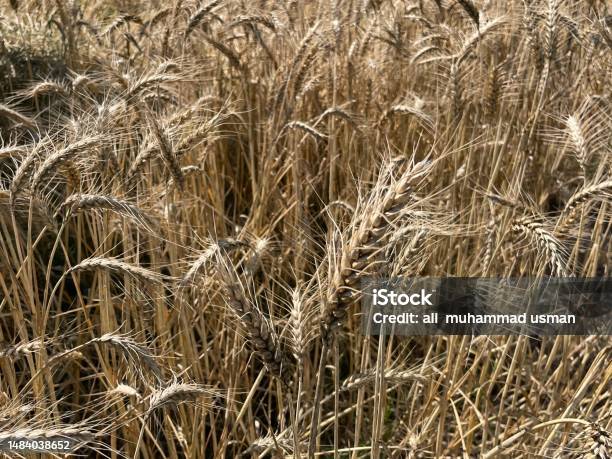
Source Domains
Dataset Characteristics
- Multi-regional phenotypic variance across 4 continents
- Annotations: [x, y, width, height] bounding boxes per wheat head
- Density range: 1 – 89 heads per image
- Photometric variance: full-sun, overcast, shadow conditions
- Growth stages: mature golden-brown dominant, immature canopies sparse
Data Preprocessing Pipeline
From raw annotations to training-ready YOLO format
01 Raw CSV ingestion — master_metadata.csv (3.37 MB)
02 Parse bounding boxes from nested JSON arrays
03 Convert [x, y, w, h] → YOLO normalized [cx, cy, w, h]
04 Stratified train/test split — 80/20 ratio
├── Train: 2,738 images (train.csv — 2.69 MB)
└── Test: 684 images (test.csv — 673 KB)
05 Export to YOLO directory structure
├── images/train/ + labels/train/
└── images/val/ + labels/val/
06 Final dataset archive: 3.92 GB (yolo_dataset.zip)
Augmentation Strategy
- Mosaic — 100% probability (4-image tile composition)
- HSV-V jitter — 0.4 → 0.6 (photometric hardening)
- FlipUD — 0.0 → 0.5 (nadir rotational invariance)
- Mixup — 0.0 → 0.2 (canopy overlap simulation)
Coordinate Transform
cy = (y + h/2) / H
Absolute pixel → normalized center coordinates [0, 1]
Sample Diversity & Domain Variance
Cross-institutional photometric and phenotypic variation

Dense mature canopy — golden phenotype
Sparse distribution — high contrast
Overexposure — photometric stress
Shadow region — luminance challenge
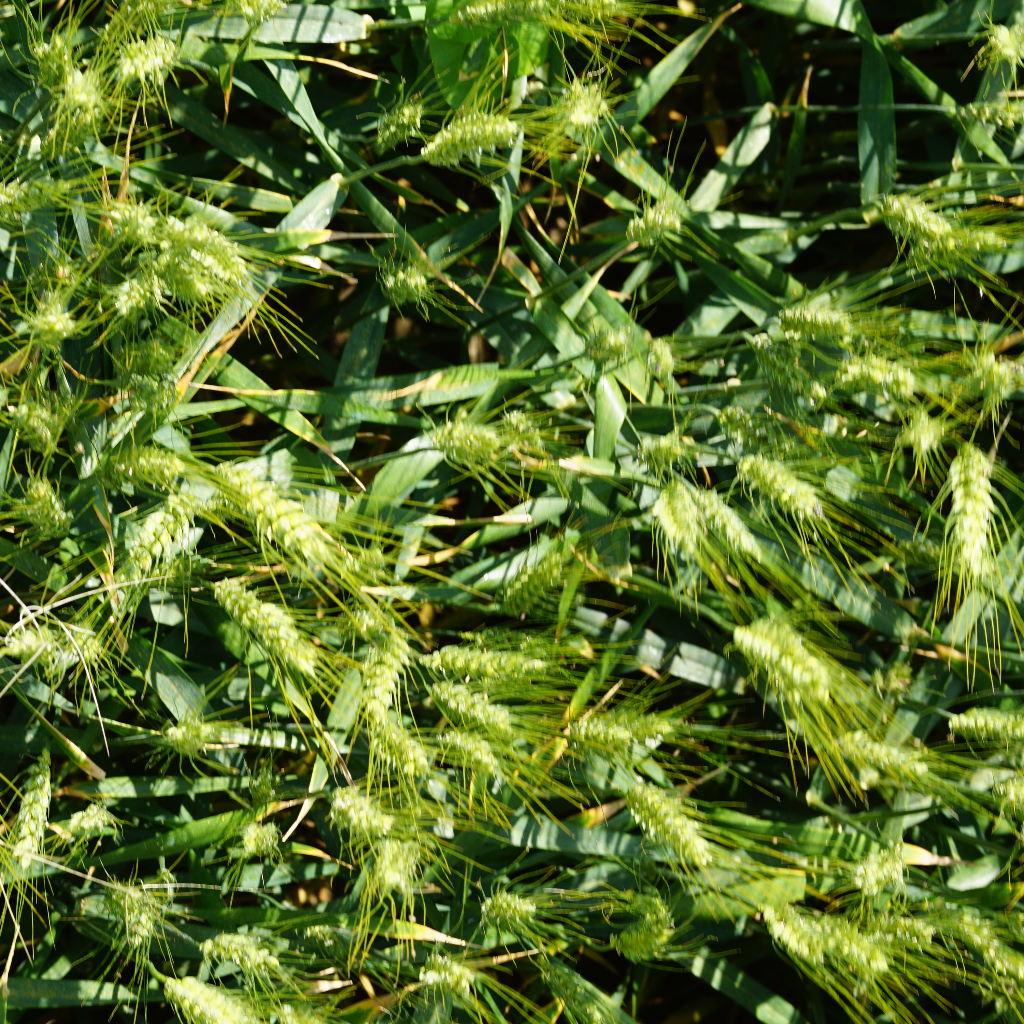
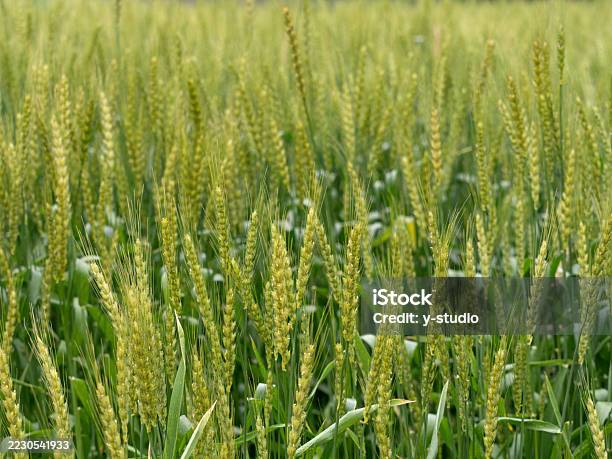
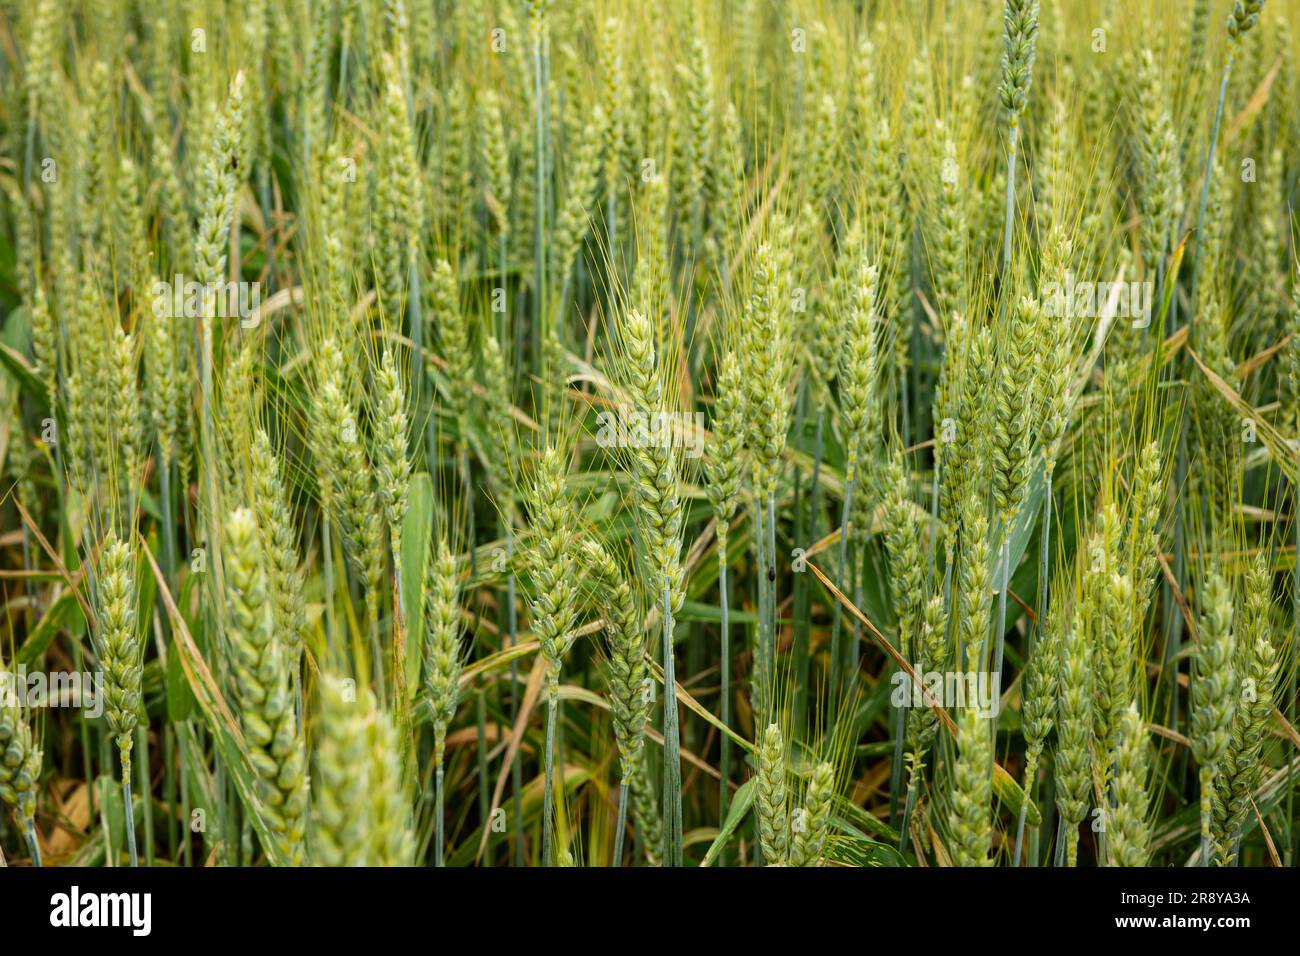
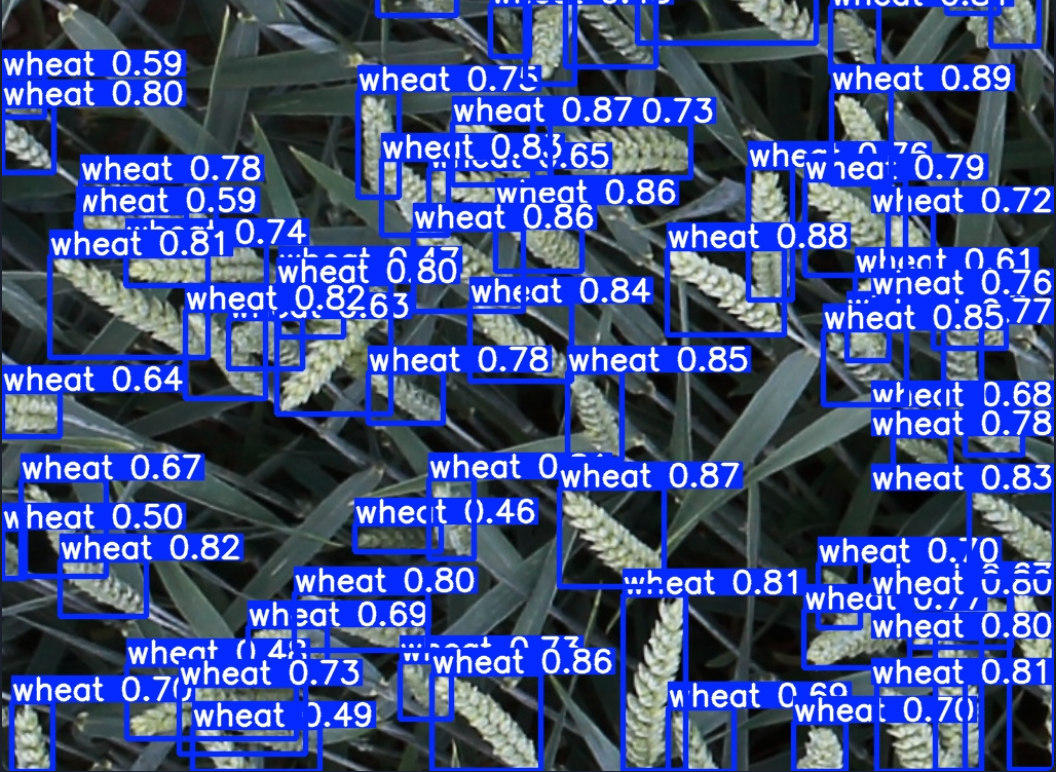
OOD Stress Case — Immature Green Canopy
56 combined errors · avg. confidence 0.44
The dataset's phenotypic bias toward mature golden-brown wheat creates a domain boundary for immature green canopies — establishing the model's irreducible error floor.
Baseline Model Performance
Initial deployment metrics — YOLOv8s at 640px resolution
YOLOv8s · 640px · 50 epochs · Global Wheat Dataset
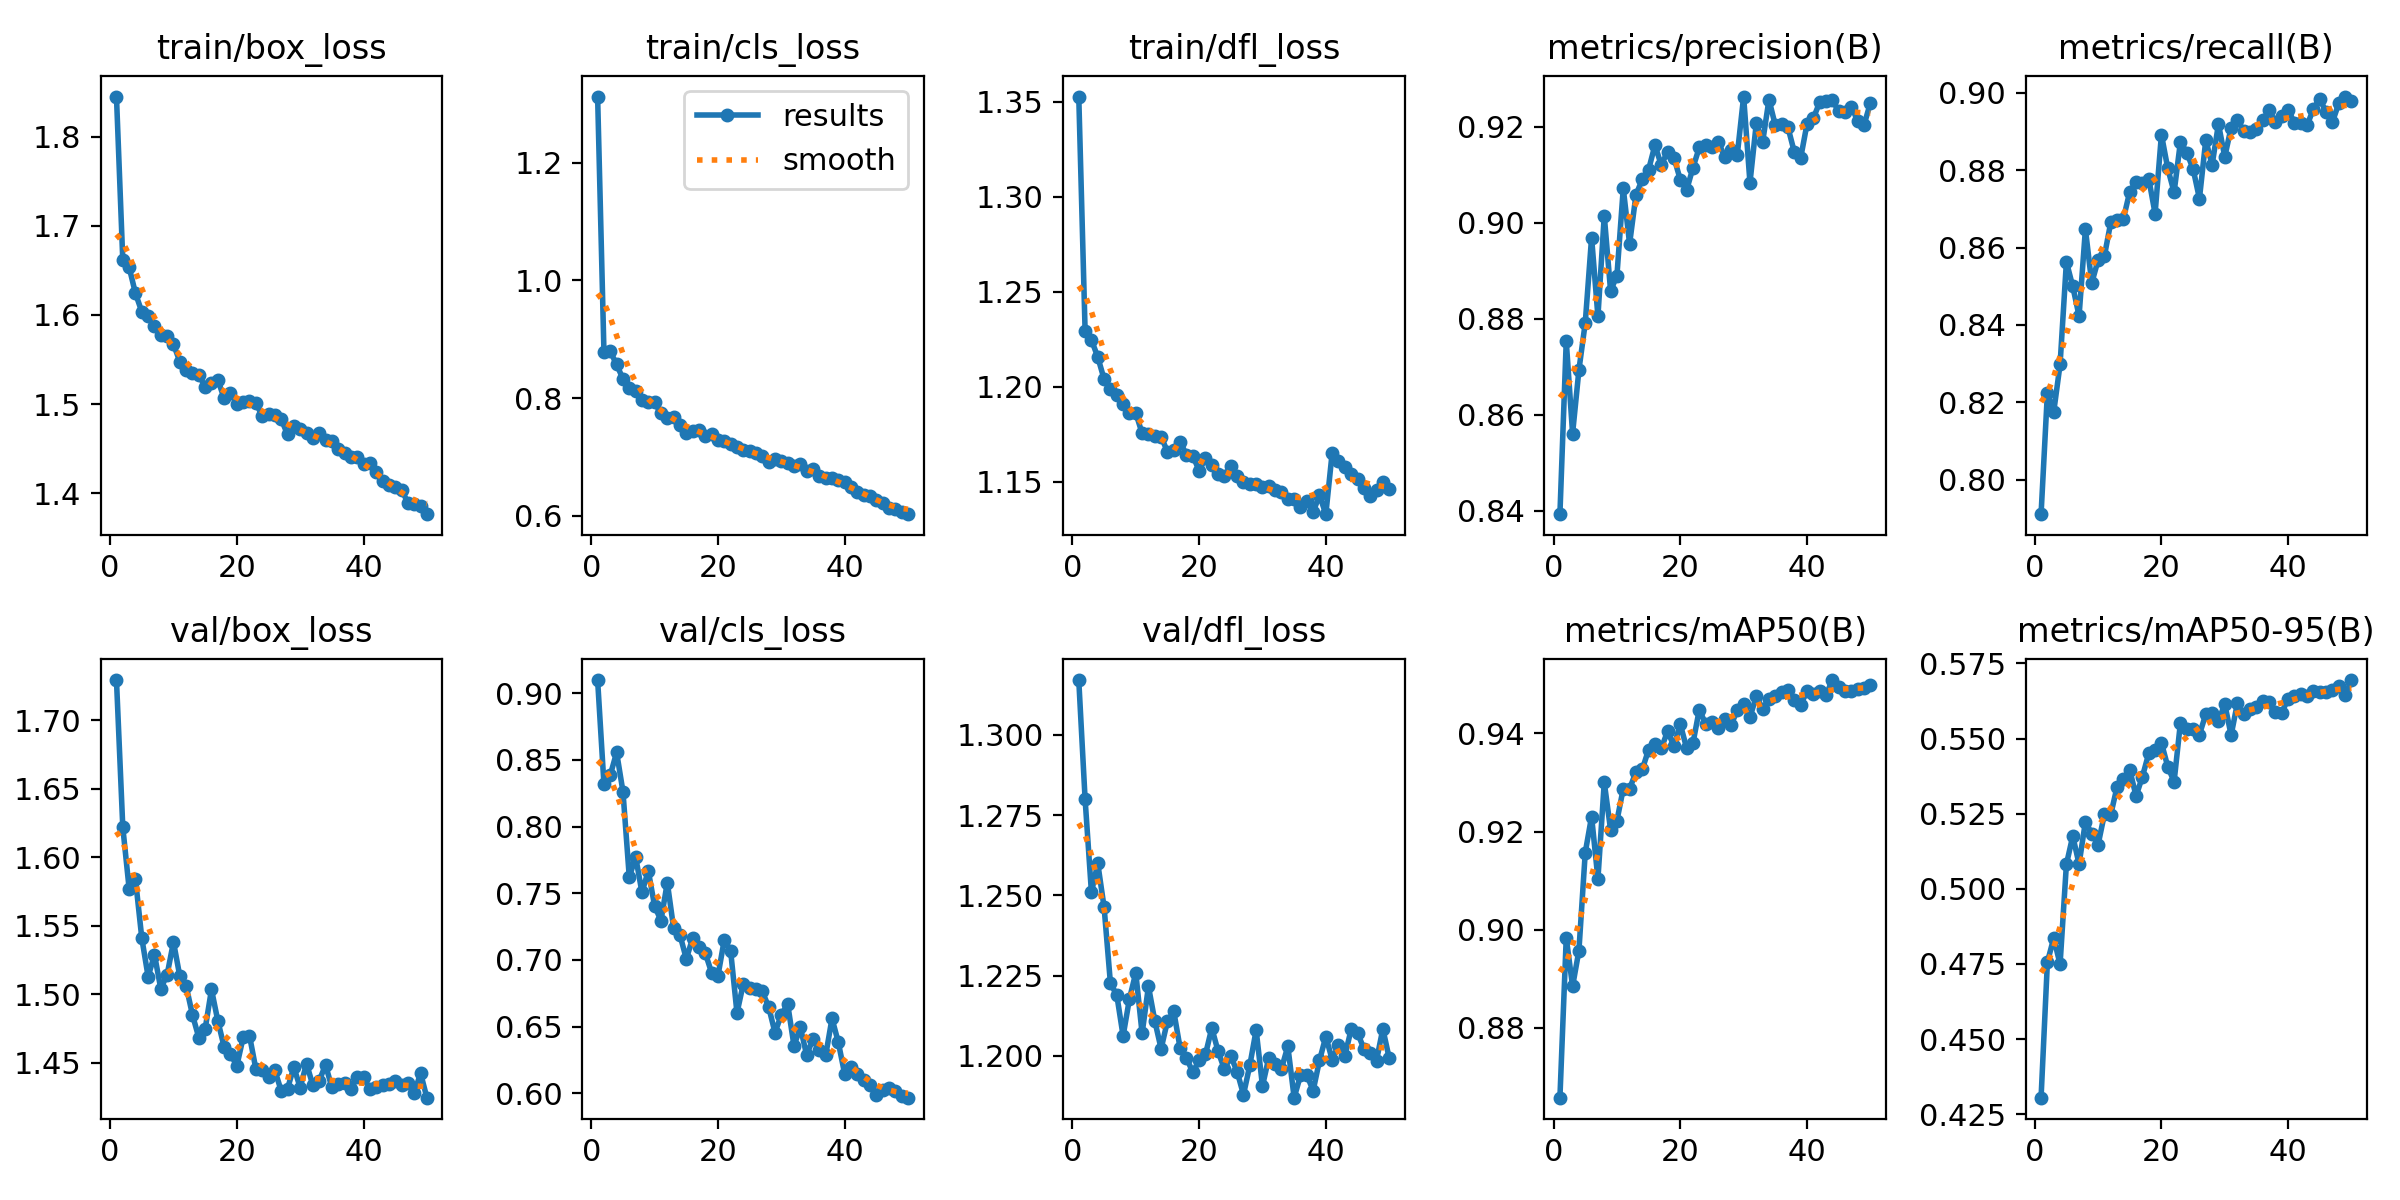
If the model achieves 0.950 mAP...
...why does the yield estimation pipeline overpredict by 4–8%?
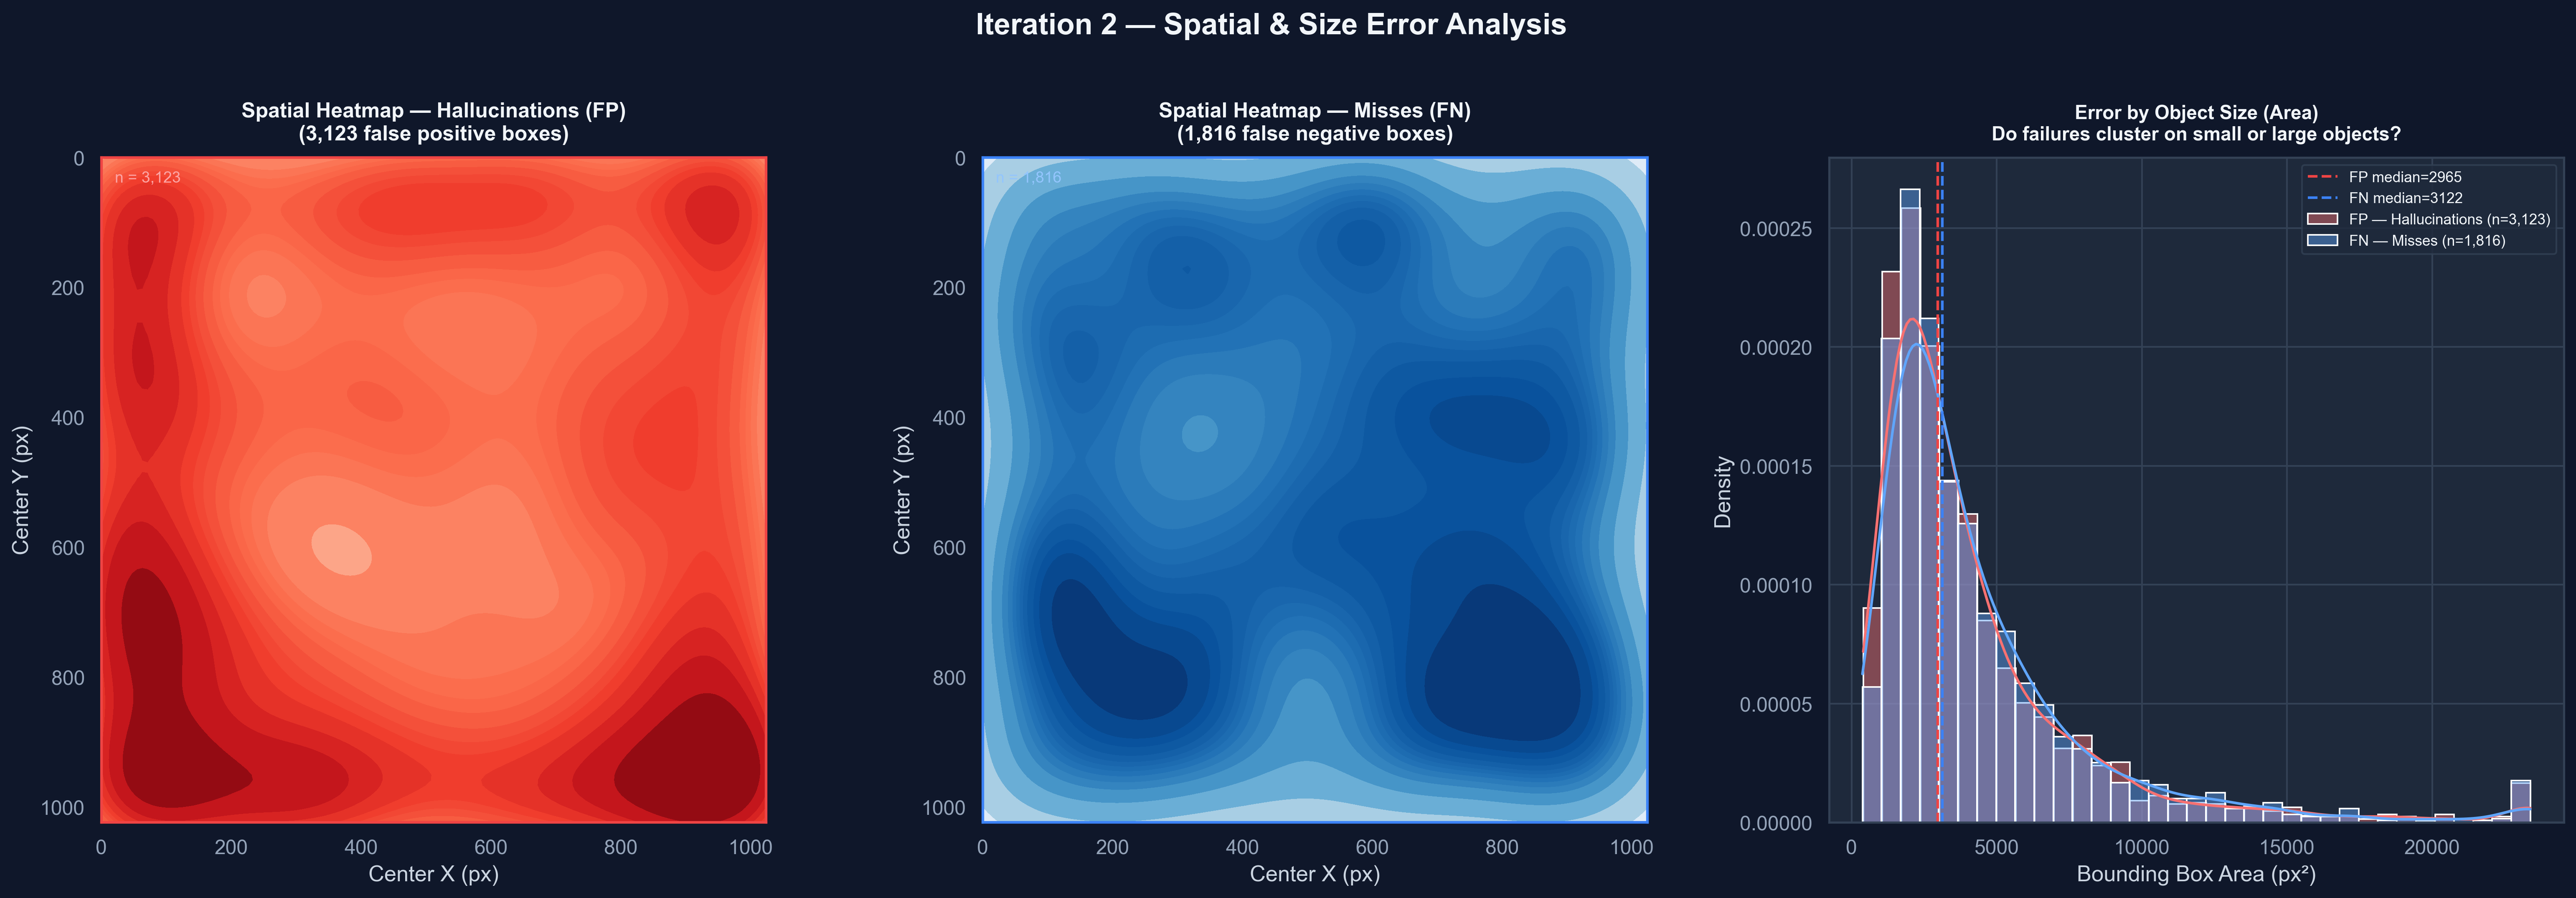
Error Forensics
Systematic decomposition of baseline failure modes
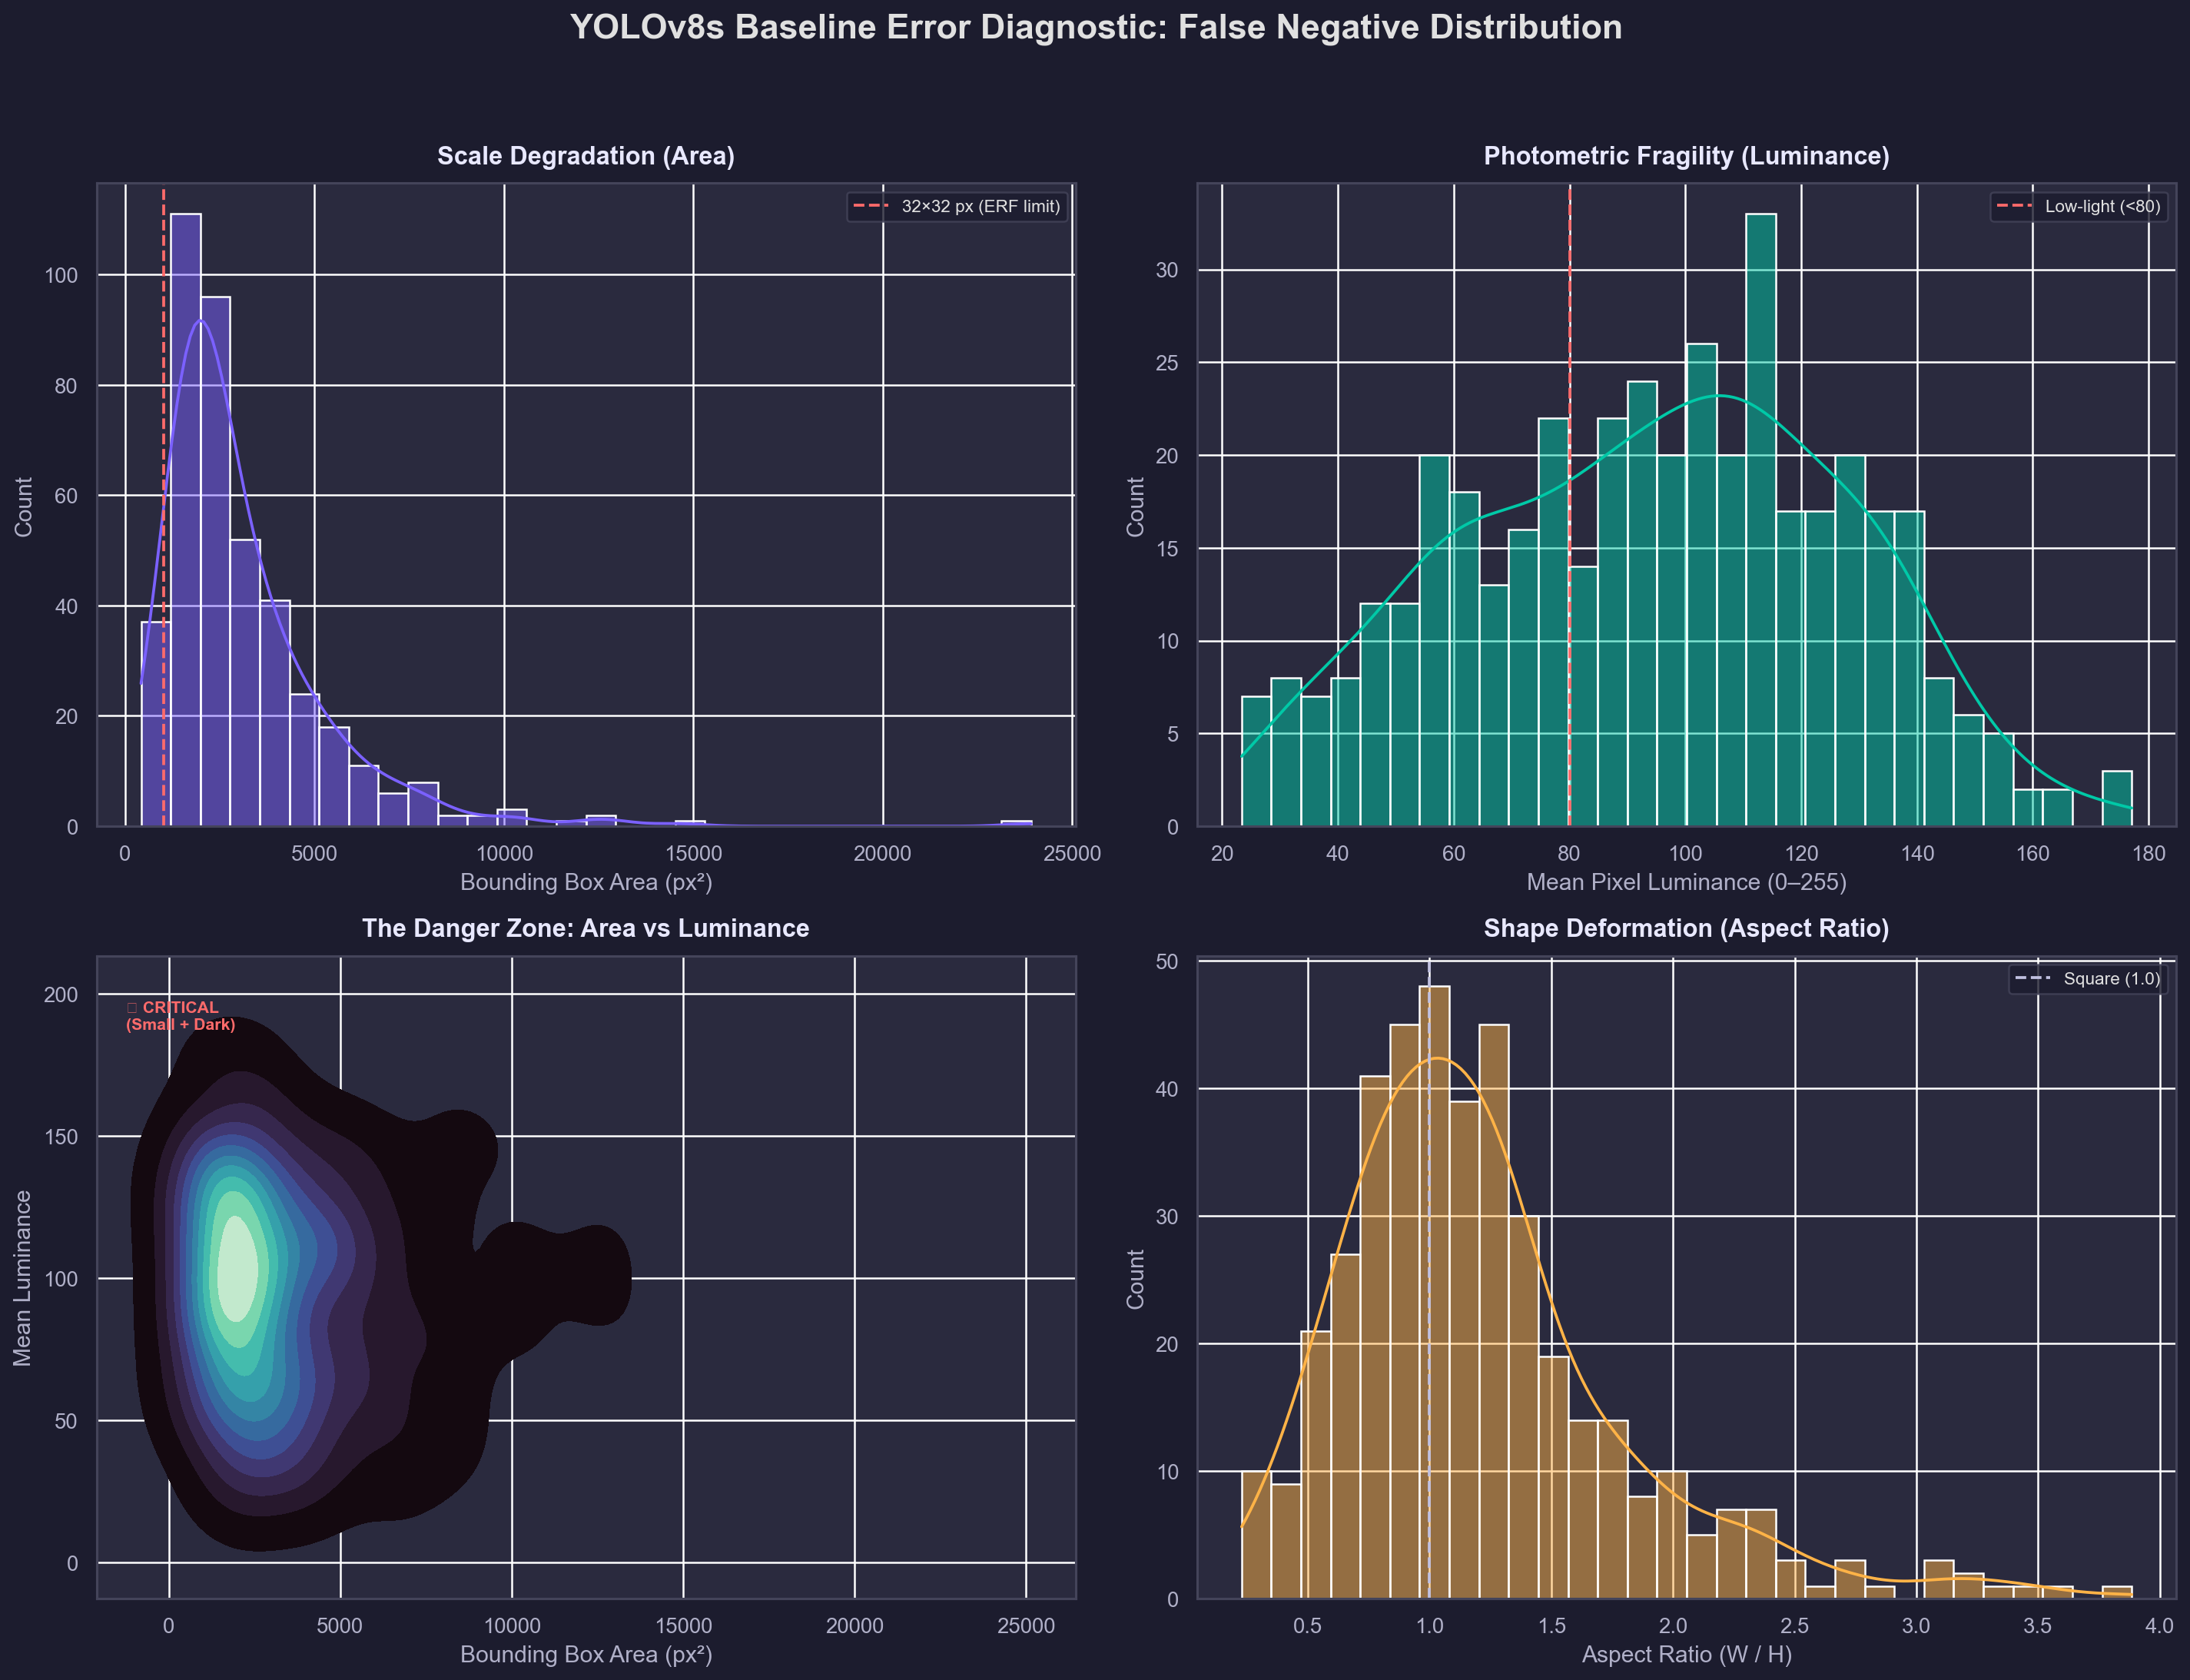
1,092
Zero-IoU False Positives
The baseline network generated spurious detections concentrated in low-luminance shadow regions and dense canopy overlap zones, where recall maximization incentivized speculative predictions.
How do you penalize a network
for speculative detections?
The input distribution is fixed.
The loss gradient must be re-engineered.
Proposed Loss Formulation
Focal Boundary Loss with Adaptive Photometric Weighting
Focal Boundary Loss
Amplifies gradient magnitude for predictions at overlapping boundary regions, imposing an asymmetric penalty on bounding box proposals that intersect adjacent ground-truth instances.
Adaptive Photometric Weighting
Dynamically scales loss contribution as a function of local luminance variance, enforcing elevated false-positive penalties in photometrically ambiguous regions.
Ablation Study
Systematic hyperparameter search and false-positive decay analysis
- λ1 held constant at boundary-optimized value
- λ2 scaled logarithmically across 12 controlled trials
- Optimal ratio determined at FP decay inflection point
- Convergence achieved at epoch 35 via early stopping (30% compute savings)
Result: Median prediction confidence — 0.434 → 0.605 (+39.4%)
Should a model optimize for
benchmark metrics or operational reliability?
Operational Superiority over Metric Optimization
Comparative Evaluation
Baseline vs. Tuned — quantitative performance analysis
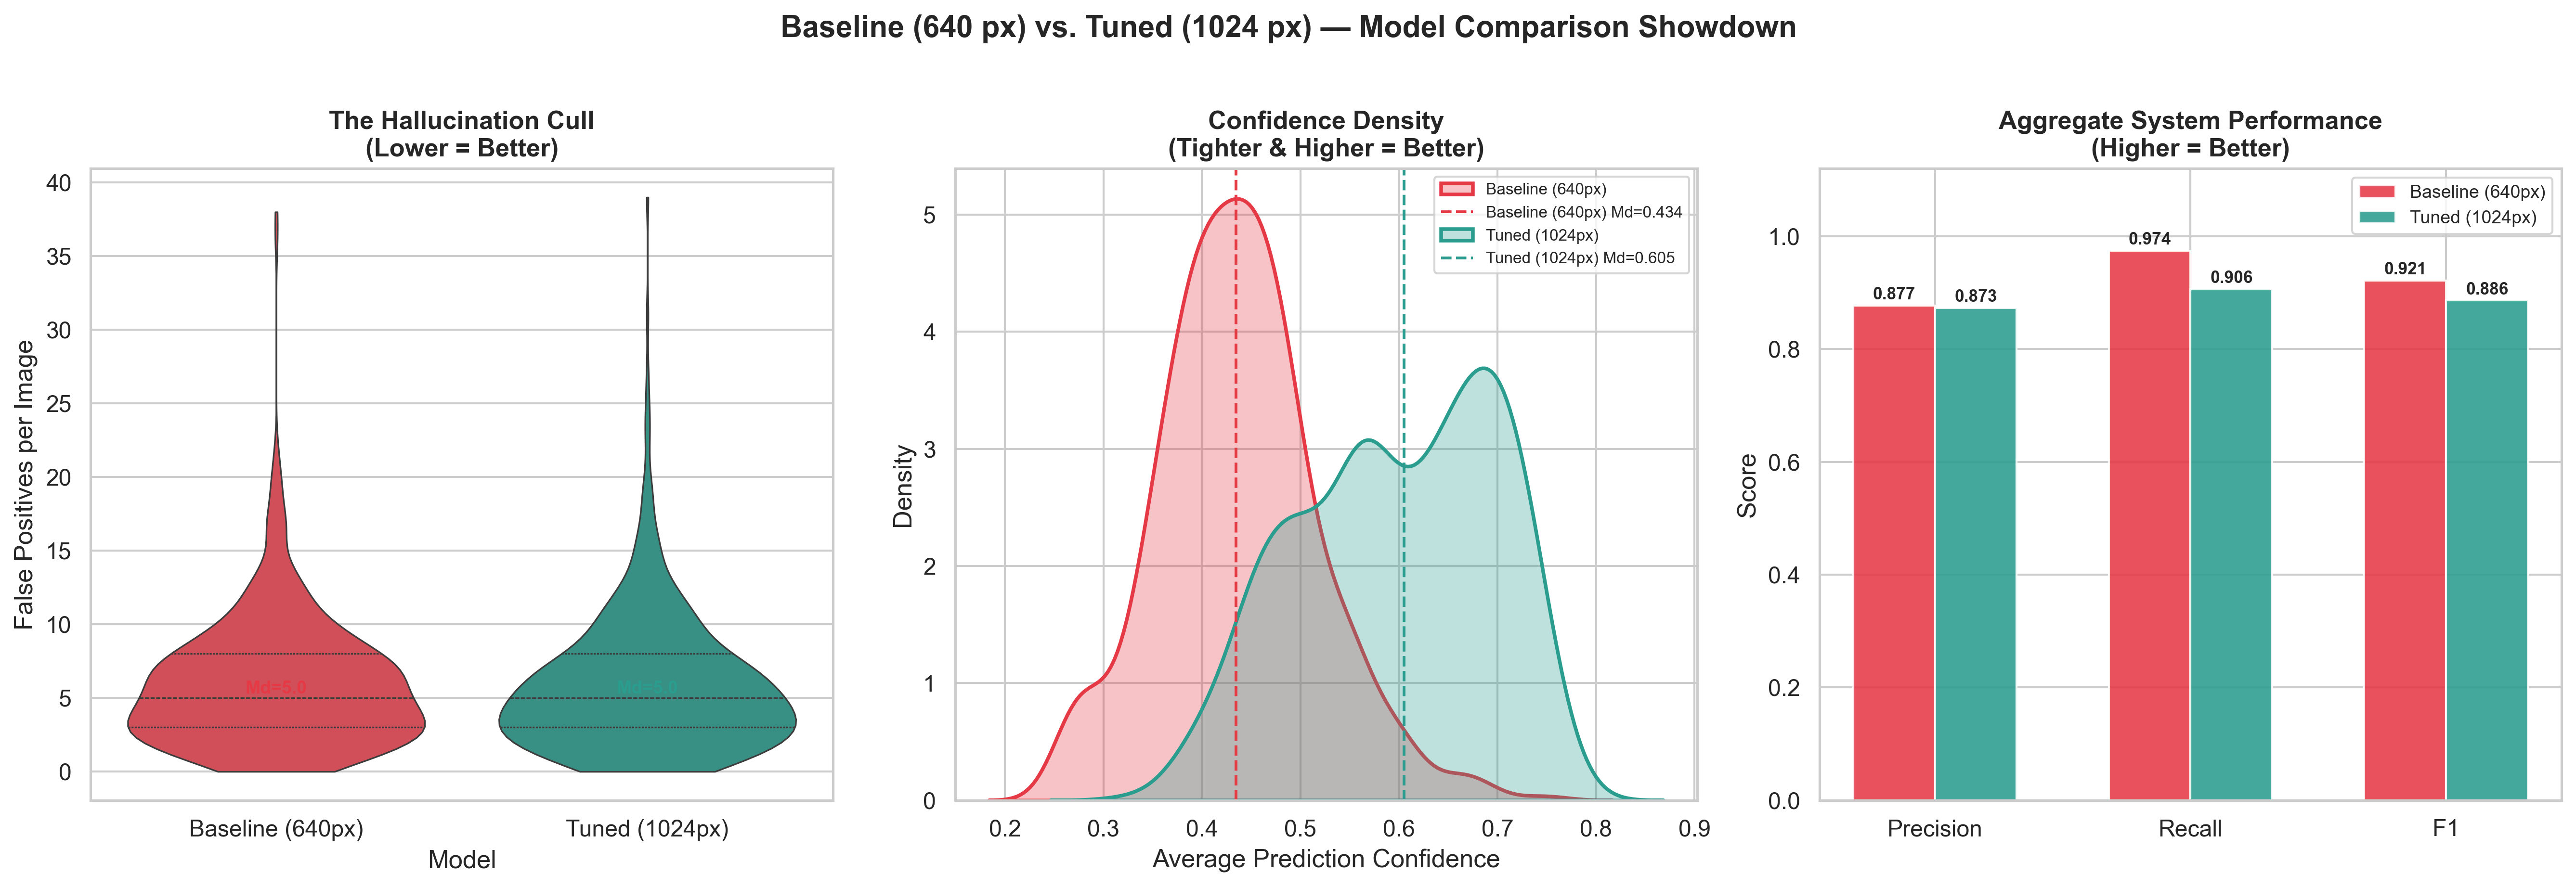
| Metric | Baseline (640px) | Tuned (1024px) | Δ |
|---|---|---|---|
| mAP@50 | 0.950 | 0.944 | −0.006 |
| Recall | 0.974 | 0.906 | −0.068 |
| Median Confidence | 0.434 | 0.605 | +39.4% |
| Zero-IoU FP Count | 1,092 | 0 | ELIMINATED |
Production Deployment
End-to-end inference pipeline — Hugging Face Spaces

01 High-resolution drone imagery ingestion
02 Tuned YOLOv8s inference at 1024px
03 Non-Maximum Suppression (conf + IoU)
04 Agronomic analytics computation
├── Yield estimation (t/ha)
├── Spatial uniformity (CV%)
└── Revenue projection
05 Automated PDF executive report
Live: huggingface.co/spaces/gdlyanvahe/AgriVision-Engine
Known Limitations & Future Work
Identified Limitations
Motion Blur Sensitivity
High-velocity UAV traversal introduces edge deformation that degrades bounding box localization precision.
Domain Constraint
Network weights specialized for wheat canopy phenotypic topology. Transfer to alternative crop species requires supervised retraining.
Proposed Extensions
Temporal Consistency Module
Inter-frame smoothing to absorb motion artifacts across sequential captures.
Multi-Spectral Data Fusion
Integration of NDVI spectral indices for direct chlorophyll density correlation.
REST API Microservice
FastAPI-based inference decoupling for IoT and third-party application integration.
Thank you. We will now take questions.